
Planning the Garden: What goes where now?
Yesterday I shared the 100+ varieties of plant that we are going to be growing in our garden this year. How did I know that we would be able to plant 100 different varieties of plant? And how did I know which plants we could plant how many of? Did I just wing it and order what I liked?
No. We are not wingers. Okay, I’m happy to wing it on some things. But not things like this. My job is in a field called Monitoring, Evaluation, and Learning. This is the practice of collecting information about programs to understand whether they’re achieving their objectives, if not why, and how they or similar programs can adjust their approaches to improve their effectiveness. Now, a person doesn’t go into this line of work - particularly the M or the E - if they don’t really like spreadsheets. Spreadsheets being the manifestation of a thoroughgoing desire to understand how things are performing and to make adjustments accordingly.

Now, a proper ag operation will have sophisticated tools for doing this - but they cost $$. There are apps for the home gardener, but none of them did exactly what I was hoping for. The closest I found so far was Planter. It allows you to plot your gardens using a square-foot gardening approach, and gives advice on companion planting and when to start seeds. I used it to plan where everything would go, and to calculate frost dates based on our zip code. It didn’t offer everything I wanted, though, including the assortment of heirloom varieties I will have. Overall, it was a great planning tool - but it didn’t offer the most important feature, of being able to document issues in your garden and track productivity to inform choices for the next year. Don’t get me wrong - it’s a great app, and I especially like that the development team shares a list of suggestions they’ve gotten and whether and when they’ll add new functionalities. I’ll be using this tool every year.
But, it didn’t obviate the need for a spreadsheet. Also, an excuse to build a custom spreadsheet? Don’t mind if I do!

In planning a tracker, it’s important to decide what you need to be able to track before you start building. You need to know:
1) Your unit of tracking - what will be your unique subject? In a lot of evaluation research, the subject is the individual person and you track information about them. I had a choice - would a subject in my tracker be a plant varietal? That wouldn’t allow me to test for differences in performance based on where the plant is growing. The conditions are very different from the East to the West side of our garden, and the drainage varies from the front to the rear. I decided that each square foot of the garden should be the unit of analysis. I can still conduct analyses by variety, since I’ll be planting a single variety in each square foot.
2) Your primary outcome. You need to know what your primary outcome is. There are a lot of things you can track about a plant and how it’s growing. You can track height, vigor, health, etc. A common pitfall I see in my work is “outcome creep”. It’s natural to acknowledge that the benefits of our programs are multifold and complex; but trying to track too many outcomes at once increases the measurement burden by many times, and can create ambiguity when one outcome winds up being traded off against another. If my home garden was a development program, it’s not unlikely that I’d be expected to document health outcomes in the members of our household and whether this garden has improved our incomes. Personally, reductions in stress and increases in satisfaction and in the quality of our meals are more important to me - as development practitioners, we too often (sadly) overlook such experiential aspects of our programs. But that’s a topic for another day.
In the end, productivity is the most important variable to me, for tracking purposes. It’s the variable on which I will make the most decisions, including whether to continue planting each variety and whether it’s in a good spot in the garden. Hence, I’ve selected a simple measure of weight of harvest for each plant. This outcome variable will work for most of the plants we’re growing; less so for the herbs and flowers, so for those I’ll be relying on a more subjective measure of rigor.
3) Other variables. I’ll track some other variables, including any pests or diseases that affect each plant, as well as what we’ve done to prevent or address them and how those approaches worked.
So now I know what I want to track, and I can start to build the tools. Since my unit of analysis is the unique square foot of the garden, I needed to find a practical way to assign a unique ID. Sure, I could number the plots 1 to 500+. But I wanted a system that would allow me to connect the ID number with an aspect of the garden plot. Building an intuitive logic into your naming system can be helpful later.
First, I wanted a visual representation of the plots and the square feet within each plot. I did this in Google Sheets, setting it up so that it acted like grid paper. This allowed me to make a map of the garden. Our garden is symmetrical, with banks of raised beds on either side of a central axis. The east side of the garden gets bright morning sun with little shade throughout the day. The west side of the garden doesn’t get full sun until noon, and the afternoon sun is dappled by the shade of an oak tree in the yard below. Because they have such different conditions, I decided to organize our tracking system with a clear demarcation between east and west.
We also have three rows of beds in the front part of the garden. In the third row, there are cherry trees, and above that a tier without raised beds that is occupied by lavender and blueberry bushes. Above that is a row of espaliered apple trees. There are two more tiers in the very back that we are using to gather compost for the moment. We may bring these into garden space in future years, but for now we’re focusing on the three rows of raised beds at the fore of the garden.
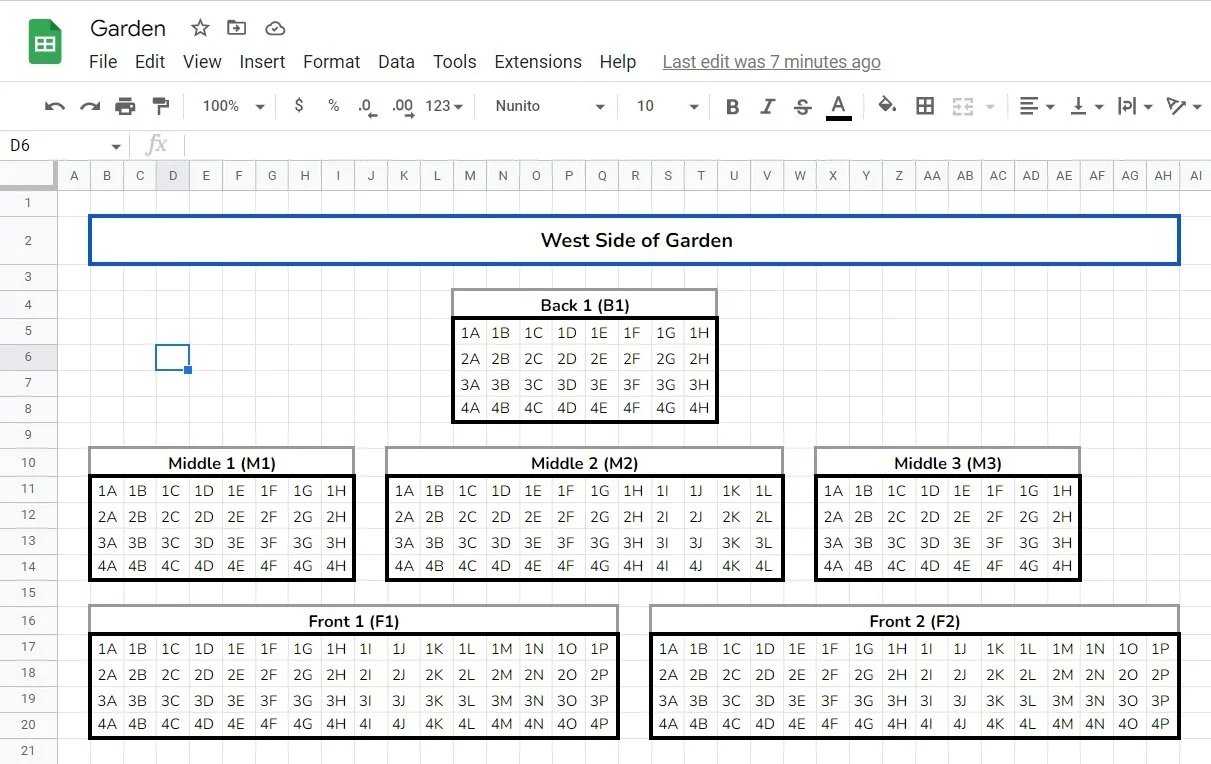
Each plot has a label according to which of the three rows it’s in, numbered from left to right (west to east). There are four front-row beds, six middle-row beds, and two back-row beds. So, F1 - F4, M1 - M6, and B1 and B2. Each plot is four square feet wide and a variable number of feet long, ranging from eight to sixteen. So I numbered each square foot within each plot similar to how a spreadsheet’s cells are labeled, from 1A to 4A in the first column of squares, 1B to 4B and so on depending on the length of the garden. The screenshot below shows the plot layout with labels included. That is a tab labeled “Plot layout”.
After building the plot layout maps and working out the numbering system, I built the primary tracker. It’s called “Primary Yield Tracker” and will be the main place where I capture data on the productivity of each square foot of garden.
First, I created a row for each of the 544 individual square feet of the garden. I added a column for the side of the garden (E or W) and then columns for which plot and square - this allowed me to run a CONCAT formula in google sheets to assign a unique ID to each square foot - =CONCAT(B2,C2). That was easier than generating the 544 unique IDs one by one.
Then I added some of the other columns I’ll need - the year, so that I can track future years’ data against this year’s. Then the plant and the specific variety. I added the number of plants that will be planted in that square foot, ranging from 16 at the high end for radishes, to 0.25 at the low end for tomato plants that require four square feet to grow well. This was where the Planter app really helped me out. I was able to plan things out with companion planting in mind and information about plant density using their drag and drop functions. Then I cross-referenced with the Planter plots to add information to the spreadsheet.
By including a column with number of seedlings / square foot, I was able to calculate the number of seeds I’d need for each variety. I did this in a separate tracker, which I called the Variety Planner tab. This tab is designed to track the varieties used in 2023 and calculate how much will be needed, as well as when they need to be started, sowed, or set, depending on the plant, the variety, and specific notes from Baker Creek.

The tab allowed me to sum the number of plants to be planted from the Total Yield Tracker, and also add information specific to the variety, including whether to start indoors or direct sow, and when to start and when to set in the plot. I did this using the SUMIF formula. For example, for the spinaches, I’m planting four plants in each square foot, and I’ll be doing four square feet of each type of spinach. It’s easy enough to calculate that as being 16 total plants of each spinach type. But the benefit of doing a formula is that you don’t need to do the calculations by hand, and if you move things around in the main tracker, it will automatically update in the variety planner. In this case, the formula looks like this:
=sumif('Total Yield Tracker'!G2:G545, "Strawberry spinach",'Total Yield Tracker'!H2:H545).
The first part is the condition range and the second part is the condition - if the “Variety” column (G) in the Total Yield Tracker is Strawberry spinach, then it gives you the total of all seedlings in the No./Sq column (H) in rows where Strawberry spinach is listed as the variety.
For each variety, I noted in a column whether it is to be started indoors or sowed directly. I did this with a simple “Y/N” for “Start indoors?”. This allowed me to sort those that needed to be started indoors from those that need to be sowed directly, so I could plan the number of seed starter pods I’d need. This was another simple SUMIF formula, where column I is the “Start indoors?” column and column E is the “No. set” or number of seedlings to be set.
=sumif(I2:I110, "Y", E2:E110)
Using this formula, I will need to start 416 seedlings. Our basement is going to be fulllllll of heat mats.
This tab also allowed me to calculate the precise dates on which each seed would need to be planted. They are either started indoors on one date and set on another, or else direct-sowed on a single date. All of these dates are in direct relation to the last frost date. I found that by entering my zip code in the Planter app. For us that’s April 11. I added a column where the value is 4/11/2023 all the way down, which will allow for the formulae to capture the date to start, set, or sow.
As one example, the nightshades generally shouldn’t be set (seedlings planted) until well after the last frost. So I entered a set date formula adding 14 days to the last frost date. They need to be started 8-12 weeks before they are set. So I subtracted 10 weeks from the last frost date as my start date, when I’ll start to germinate the seedlings indoors. This gives me a start date of January 31 and a set date of April 25.
The last frost date is just an average; if we have a warm spring it’s possible things could be set earlier, especially if you plant using bells (glass domes that create a warmer microclimate around seedlings that have been set - I have used quart sized Ball jars with great success; and you can use those jars for pickles later in the season). But this lets you know by what date you need to have all your seeds and starting gear purchased, in our case by the end of January.
So really, starting to do your planning and shop for seeds at Christmas is perfectly timed. It feels like a nice tradition - anticipating spring makes the rest of winter feel a bit less dreary.